Customers will leave you at the drop of a hat these days. Consumers have more options, more knowledge, and are more fickle than ever before. And all it takes is a click of a button to engage a different brand and potentially find the customer experience (CX) they need and which your business is not delivering, regardless if this perception is justified or not.
As Warren Buffett once said, “It takes 20 years to build a reputation and five minutes to ruin it. If you think about that, you’ll do things differently.”
According to American Express research, “33% of Americans say they’ll consider switching companies after just a single instance of poor service.” The speed at which a customer will leave a brand is enough to make any business owner paranoid and anxious to “do things differently,” as Buffett suggests.
But what does doing things differently actually look like when it comes to reimagining your customer’s experience to keep them happy and loyal? Customer satisfaction Key Performance Indicators, or KPIs, can help you define what doing things differently means specific to your industry and consumer base.
Customer satisfaction is hard to quantify, as it is in the eye of the customer. The customer experience is difficult to nail down also, as it is the perception of the customer about its experience with your brand across all engagement channels and multiple interactions.
A business will never be able to assign an accurate, single number to customer satisfaction or the customer experience. However, customer satisfaction KPIs can help businesses and their teams get closer to truly understanding where and why customers are happy, indifferent, or dissatisfied with your brand. Customer satisfaction KPIs empower business teams to solve customer experience problems and take stronger advantage of areas of customer satisfaction strengths.
Here are five key customer satisfaction KPIs that your business needs to start tracking right now.
KPI #1: Satisfaction
Measuring, monitoring and assessing customer satisfaction levels is a baseline metric for all CX tracking programs. Customer satisfaction score (CSAT), attributes a number to quantify customer satisfaction levels. The higher the number, the better the customer experience, generally speaking. Remember, highly satisfied customers are more likely to do business with you again and refer you to other customers. Unsatisfied customers might switch their loyalties to another brand. Measuring satisfaction and translating that data in a CSAT score is typically done via customer surveys. These surveys can be complex, but the most effective survey types are easy for a customer to complete and are phrased accurately.
How to Calculate CSAT
As an example, your customer makes an online purchase. At the close of the purchase process, a pop-up window might ask: “How would you rate your overall experience today?” or some other iteration of this question, like “How would you rate your overall satisfaction with the service you received today?”
- Response choices would be on a scale of 0-5 presented in the following manner:
- Very unsatisfied
- Unsatisfied
- Neutral
- Satisfied
- Very Satisfied
- Now, there are variations for every KPI method of measurement; scales could be 0-5, 0-8 or 0-10, depending on the industry and what you’re after.
- What you’re looking to develop is a composite CSAT score, which is typically rendered in a percentage, calculated this way:
.png?width=508&name=customer-satisfaction-equation%20(1).png)
- This approach is called a “top-2-box” measure because it only factors in the top two highest rankings
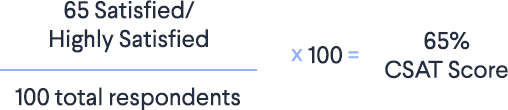
Example of CSAT Calculation
So, you query your customers and ask them to take 15 seconds to respond to a brief survey with the question and answer options outlined earlier in this section.
- You received 100 total responses
- 65 of these responses were either “Satisfied” or “Highly Satisfied”
What CSAT Scores Could Mean
What a CSAT score tells a business, generally, is whether or not customers are happy with your service, product, or both. A higher CSAT score is a good sign, for sure, but it’s important to remember that any individual KPI is only part of what should be a larger customer experience measurement platform. That said, a strong CSAT score over time usually is a sign that what you’re doing is working and that, if you’re generating new customers, your business is growing.
KPI #2: Customer Effort Score (CES) or Average Resolution Time
How much effort did a customer need to invest in order to solve a problem or obtain what they needed from your company? Measuring CES — and its closely related KPI, Average Resolution Time (how long it takes a customer service interaction to be resolved satisfactorily for the customer) — is critical to maintaining high customer satisfaction, retaining customers, and reducing churn.
How to Calculate CES
A CES score is usually gathered through a short post-engagement survey, and measured on a scale of 1-7, with 1 being high effort. The higher your CES score, the better on most scales. CES is calculated in a similar way to CSAT:
CES (%) = Total # of respondents who agree (5 or above) / total # of respondents surveyed × 100
A sample question might be: “Company A made it easy for me to solve my problem.” You could then create a response matrix ranging from:
- Strongly Disagree (1)
- Disagree (2)
-
Somewhat Disagree (3)
-
Neutral (4)
-
Somewhat Agree (5)
-
Agree (6)
-
Strongly Agree (7)
Example of CES Calculation
Company A decided to execute CES surveys following every new purchase and customer service interaction. They collected 135 total responses, of which 98 respondents indicated agreement in some way.
400 Indicated Agree in Some Way / 500 responses × 100 = 80% Customer Effort Score.
Note: The goal is to make things as easy as possible for our customers, particularly with this type of question. If the survey is too complex, fails to work properly, or in any way causes your customers a headache, the survey itself can become its own problem, increasing customer effort and skewing your data. So be careful how you craft and deliver this type of survey so you can ensure you get unpolluted data back.
Tracking, assessing, and adjusting your approach based on CES is a key component to successful CX management.
What CES Data Could Tell You
Obviously, a high CES percentage is a positive sign. This generally means you’re making your customers’ lives easier by solving their issues in a convenient way for them. The less pain, the better. HubSpot collected some salient points on the value of tracking CES consistently:
- CES is the strongest predictor of future purchase behavior (according to an HBR study wherein 94% of customers reporting low effort said they would repurchase, while 88% said they would increase their spending).
- CES is a strong predictor of referral likelihood, as 81% of customers reporting high effort say they would speak negatively about the company to others.
KPI #3: First Response Time
First response time is closely related to CES, but is narrower in scope as it focuses only on the amount of time it takes for your company to respond to a customer inquiry. The key difference between first response time and CES is that the former has nothing to do with solving the issue at hand. It purely measures speed of response.
SalesForce recently found that 33% of recent survey respondents felt positively about a company that responded quickly to their inquiry, even if this response did not provide a solution to their problem.
How to Calculate First Response Time
This one is really simple. Create a mechanism to track your team’s response to a customer inquiry. Measure the time between the receipt of an inquiry and the first response going out to that customer. You can pick a few channels or track all of them. What you track and how your customers engage with your brand and team will vary from business to business.
What NPS Data Could Tell You
If you can accurately track first response times you can determine if you team is meeting customer expectations. What’s more, these stats could highlight the importance and value of chatbots or automated email responses in customer satisfaction. Couple faster response times with stronger Customer Effort Scores and watch your customer satisfaction rates go through the roof.
KPI #4: Net Promoter Score (NPS)
The KPI measures both customer satisfaction and loyalty to your brand. NPS will tell you how likely your customers are to promote or refer your company to others. Generally, highly satisfied customers should generate a strong NPS, as these two are tightly linked metrics.
According to the Startup blog, “For most businesses, especially startups and small businesses and for the majority of self-employed workers who have small or very limited marketing budgets, NPS is crucial. Why? Because word of mouth (WOM) is the primary way these businesses get new customers. Word of mouth fundamentally comes from people’s willingness to recommend your business (NPS). Word of mouth is the most important marketing channel most of us have. As a matter of fact, in research conducted by Verizon and Small Business Trends in 2014, over 85% of small businesses surveyed cited WOM as the way in which customers discovered their business. If you have low NPS, you don’t get positive WOM.”
Now, NPS is an important metric for small businesses and larger organizations. It’s a valuable metric, though for larger organizations less reliant on referrals and word of mouth, NPS might be a lower priority and have less significance than it does with startups and small businesses. The difference is the weight of NPS’s value when it comes to different-sized businesses with varying budgets and means to generate business.
How to Calculate NPS
NPS can be broken down into three distinct subcategories, identified by their NPS on a scale of 0-10.
- Promoters (NPS: 9-10). These are your brand evangelists, those that are highly loyal to your brand and will often sing your company’s praises unprompted. You want a lot of these.
- Passives (NPS: 7-8). These are folks that are generally happy but won’t go out of their way to sing your praises or refer.
- Detractors (NPS: 0-6). These folks are not happy with your brand and will soon be out the door. You don’t want many of these, for sure.
Like CSAT and CES, NPS can be tracked via a post-engagement question like: “On a scale of 0-10, how likely is it that you would recommend Company A to your friends, family, or associates?” This would go along with a graphic indicated 10 is the highest likelihood, whereas zero is the lowest.
Ideally, it would only take five seconds for a customer to complete. Remember, we want everything — including providing feedback — to be as easy and convenient as humanly possible. We don’t want our efforts to improve the CX to become part of the problem, right?
To determine your NPS, first calculate the percentage of promoters (scores of 9-10) and the percentage of detractors (score of 0-6). Once you get those numbers, do this:
% Promoters - % Detractors = NPS
Example of NPS Calculation
Let’s say Company A generates 250 NPS survey responses. One hundred fifty are identified as Promoters while 100 are identified as Detractors.
150 Promoters / 250 total respondents = 60% Promoter Score
100 Detractors / 250 total respondents = 40% Detractor Score
NPS = 20 (60% - 40%)
What NPS Data Could Tell You
Happy, satisfied customers will recommend your services and/or products to others, which is a key to new lead generation and new customer source, as referral leads generally convert at a higher rate. A strong NPS score — remember, the higher the better — is a strong indicator that your referral infrastructure is healthy.
KPI #5: Customer Retention Rate (CRR)
This is one of the most important customer satisfaction KPIs there is. CRR measures how well your business keeps its customers over a period of time. A high CRR means low churn rates and greater revenue opportunities from cross-selling and upselling existing customers. Many customer satisfaction KPIs roll up into CRR. A high CRR is the ultimate goal of increasing customer satisfaction via a stronger customer experience.
How to Calculate CRR
CRR is fairly easy to measure. You divide the total number of customers retained by the total number of customers over a specific time period.
What CRR Data Could Tell You
Again, CRR is pretty straightforward. A high CRR means all of the things listed earlier in this section, in addition to less lead generation costs for customer acquisition. A low CRR means you have issues with customer satisfaction caused by a poor or inconsistently delivered customer experience.
CRR can be a green light to indicate you’re doing something right or a red flag indicated a major problem with how your brand and team are engaging with your consumers.